

In the previous analysis, most of the tokens had not yet completed their price cycles and were still hovering around key technical levels. This follow-up aims to extend the analysis based on the latest market developments, offering updated insights and strategic outlooks for traders and investors.
Read more: Price Prediction 5/28: BTC, XRP, LINK, DOGE, SUI, ETH & SOL
Bitcoin Price Prediction
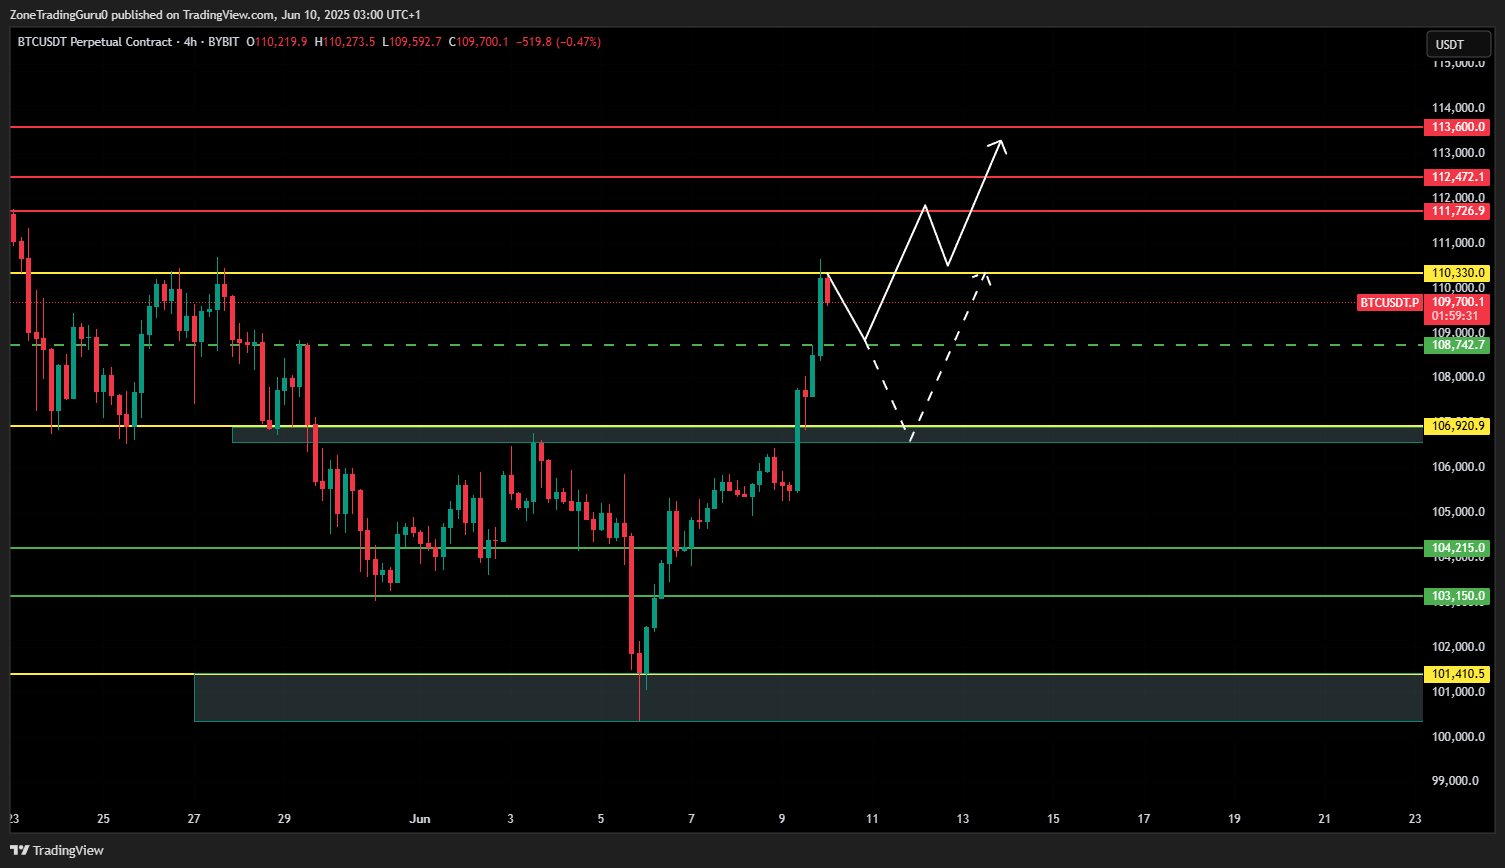
Bitcoin has staged a powerful rally, surging from $104,900 and decisively breaking through the $106,920 level before testing a key resistance zone at $110,330. This area has triggered a short-term pullback, with initial support identified around $108,750. A rebound from this level remains plausible. However, if buying pressure proves insufficient, Bitcoin may retrace further to retest the stronger support at $106,920.
A breakout above $110,330 would mark a significant bullish signal and could pave the way for a move toward the previous highs – or even a potential new all-time high.
Source: TradingView
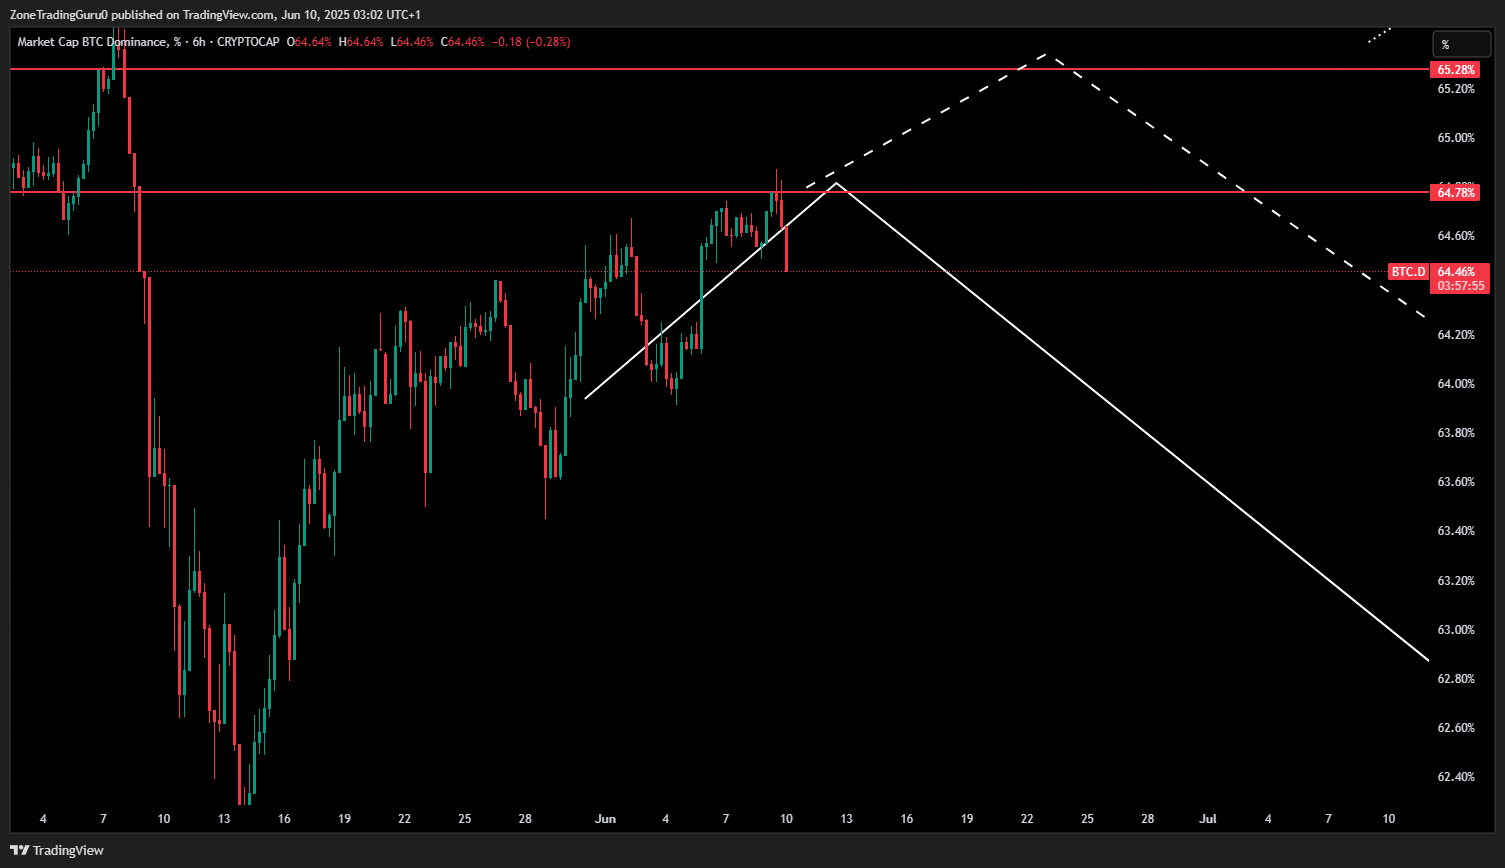
Meanwhile, Bitcoin Dominance (BTC.D) has reached the 64.78% threshold – an area previously flagged as a potential reversal point.
The subsequent decline in dominance is an encouraging signal for altcoin traders. Combined with BTC’s short-term consolidation, this opens the door for tactical long positions in select altcoins, provided timing aligns with Bitcoin’s broader price action.
Read more: Trading with Free Crypto Signals in Evening Trader Channel
Ethereum Price Prediction
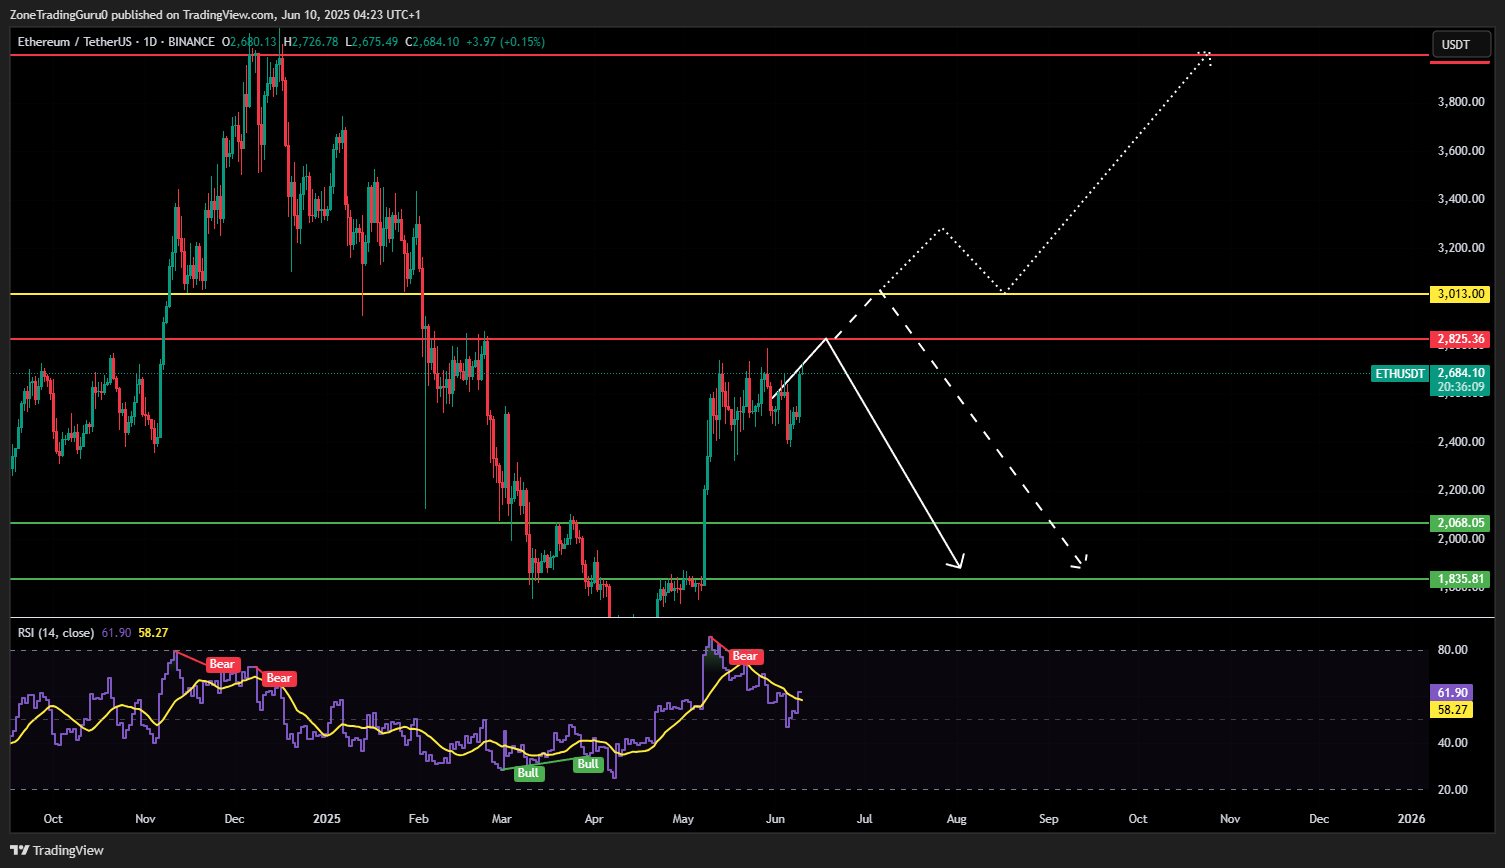
Ethereum has now logged six consecutive weeks of gains without a meaningful pullback – a pattern that often precedes a sharp correction, as unsustainable rallies tend to invite profit-taking. On the daily chart, ETH is currently trading around $2,670, nearing a key resistance zone at $2,825.36, with a major bullish inflection point identified at $3,013.
Two main scenarios are now in play:
- Scenario 1: ETH could continue climbing toward the $2,825.36 resistance. A liquidity sweep that briefly pierces $3,013 without a daily close above it would signal a potential bull trap. This failure to close above the key level could mark a local top, with a sharp reversal possibly driving ETH back toward the $2,000 zone.
- Scenario 2: Should ETH successfully close a daily candle above $3,013, the breakout would confirm the continuation of the uptrend. In this case, traders may look to buy the retest of $3,013 as new support, with a medium-term target near the previous cycle high around $4,000.
As of now, Ethereum remains in a critical decision zone. The price structure suggests growing bullish momentum, but without confirmation above $3,013, caution is warranted.
The coming days will be pivotal in determining whether ETH enters price discovery, or faces a corrective rejection.
Dogecoin Price Prediction
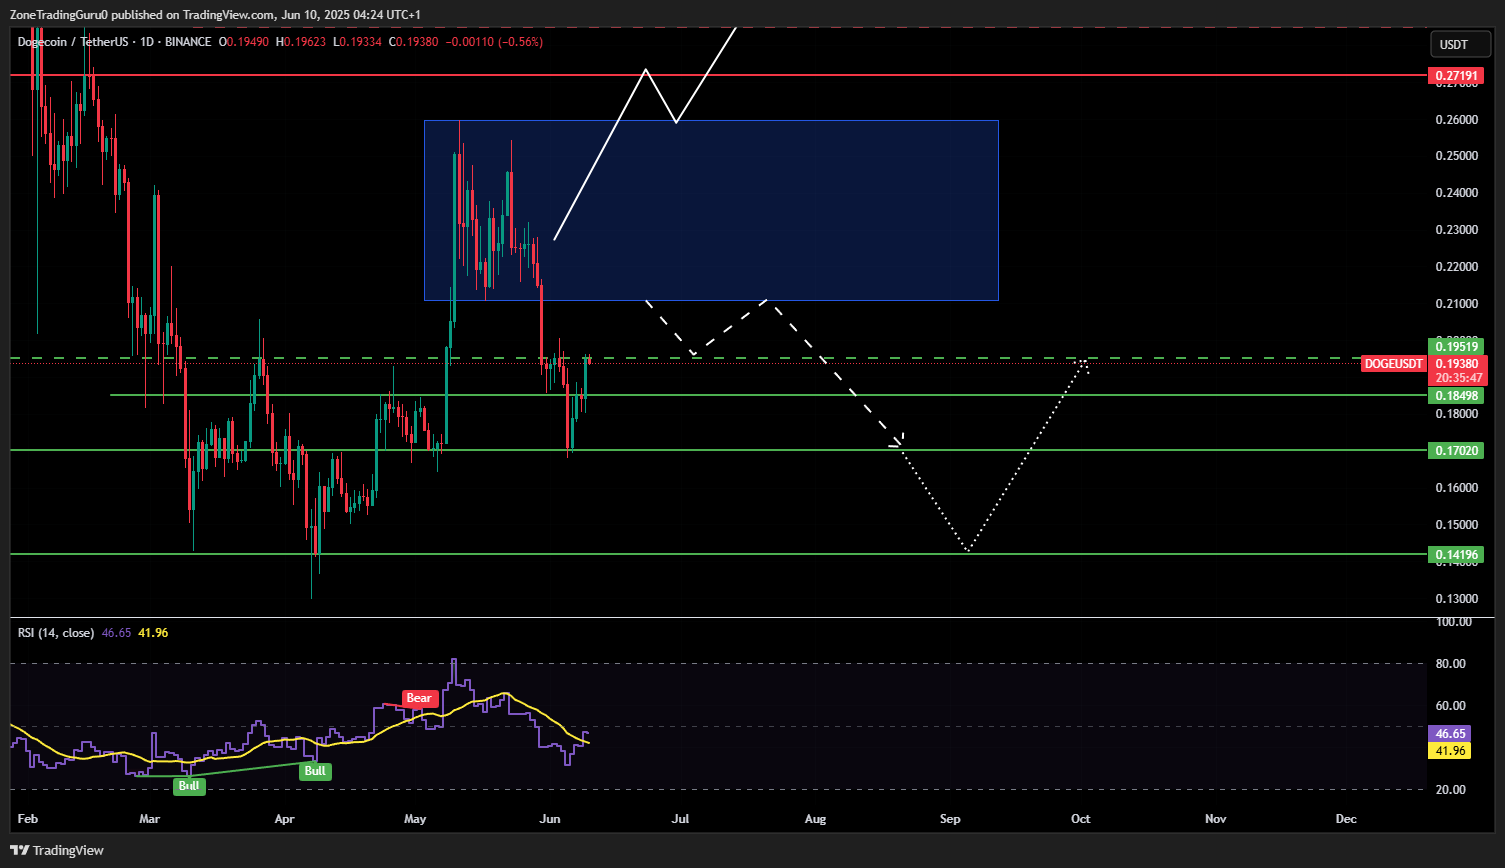
Based on the current chart, Dogecoin (DOGE) is indeed trading within the 0.26-0.21 range as previously noted, showing a sideways movement with potential risks for immediate investment. Waiting for a clear break above 0.26 or below 0.21 to confirm a trend remains a prudent strategy before planning any trades.
For the two scenarios outlined earlier:
- Case 1: If the price breaks above 0.26, consider waiting for a backtest to 0.26 to set up a buy. The price could potentially rise to the 0.31 resistance level. Watch for minor resistances at 0.2719-0.285, where shorting could be an option, but strict capital management is essential.
- Case 2: If the price breaks below 0.21, wait for a backtest at 0.21 to set up a short. Potential support levels to monitor are 0.195, 0.185, 0.17, and 0.142. A daily candle closing below 0.142 could signal a deeper drop toward previous lows.
The current price action aligns with the analysis, and maintaining discipline with these levels will be key to managing the trade effectively.
Solana Price Prediction
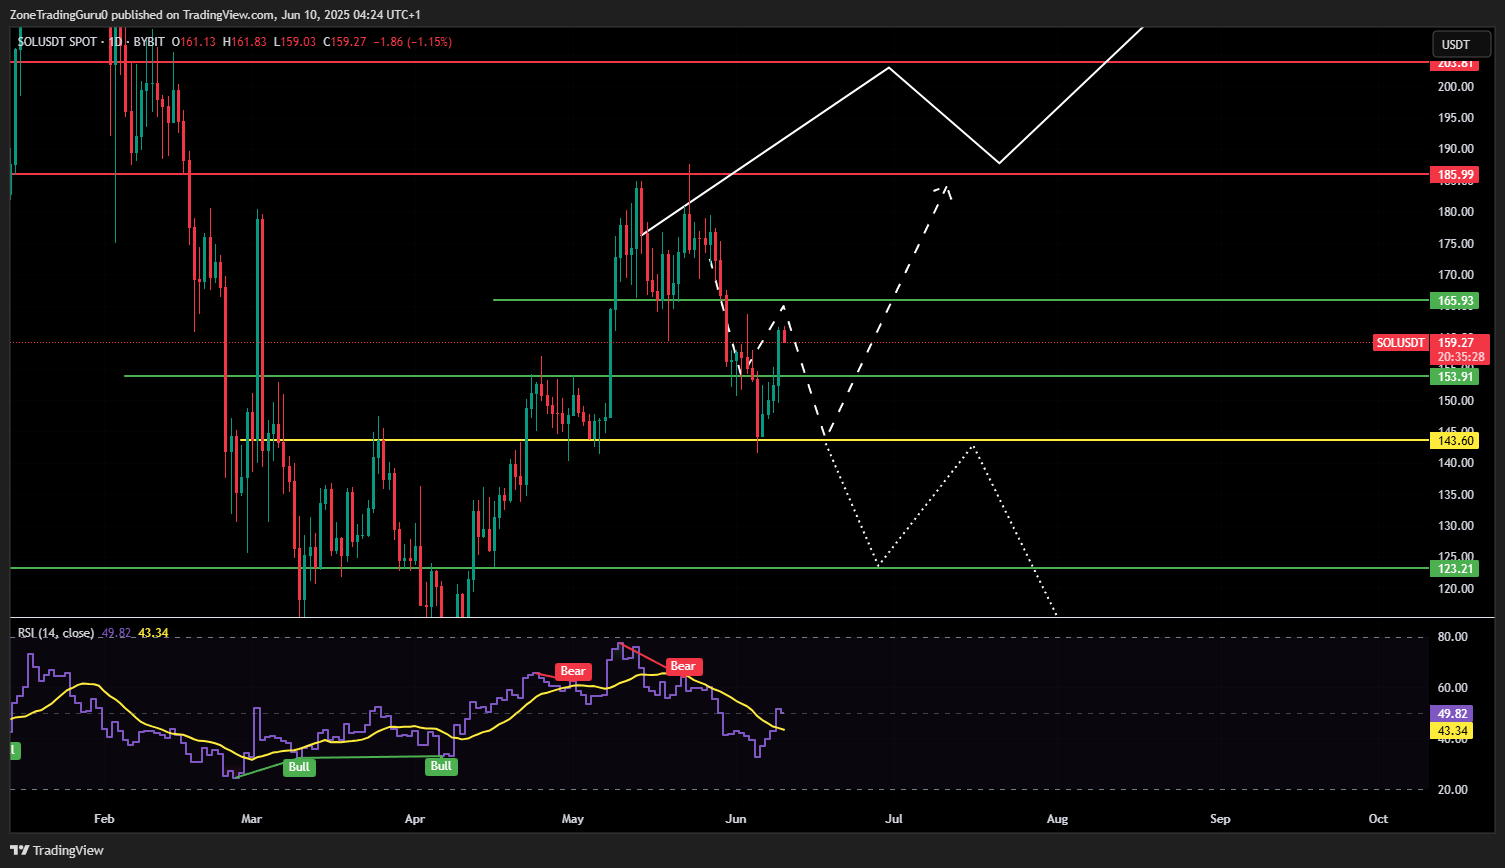
Given the current price of $SOL at around 158, it has reacted near the strong support zone of 165.93-153.9 as previously analyzed, indicating a potential test of these levels. The question of whether $SOL can reclaim its previous all-time high (ATH) or reach a new one depends on the price action around the key resistance at 186 and support levels.
Reiterating the two scenarios:
- Case 1: If a daily candle closes above the 186 resistance, it could signal a continuation of the uptrend. A buy setup could be considered after a backtest to 186, with potential targets near the previous high, estimated at 237.3-252.5.
- Case 2: If the price continues to decline, it may test supports at 165.93-153.9, with the critical trend reversal level at 143.6. A strong bounce could occur if it reaches this level. However, a daily candle closing below 143.6 would break the uptrend, potentially leading to a significant drop toward lower supports or previous lows.
With the price currently at 158, it’s hovering near the lower end of the support zone. Monitoring the next daily candle close will be crucial to confirm the direction.
Pepe Price Prediction
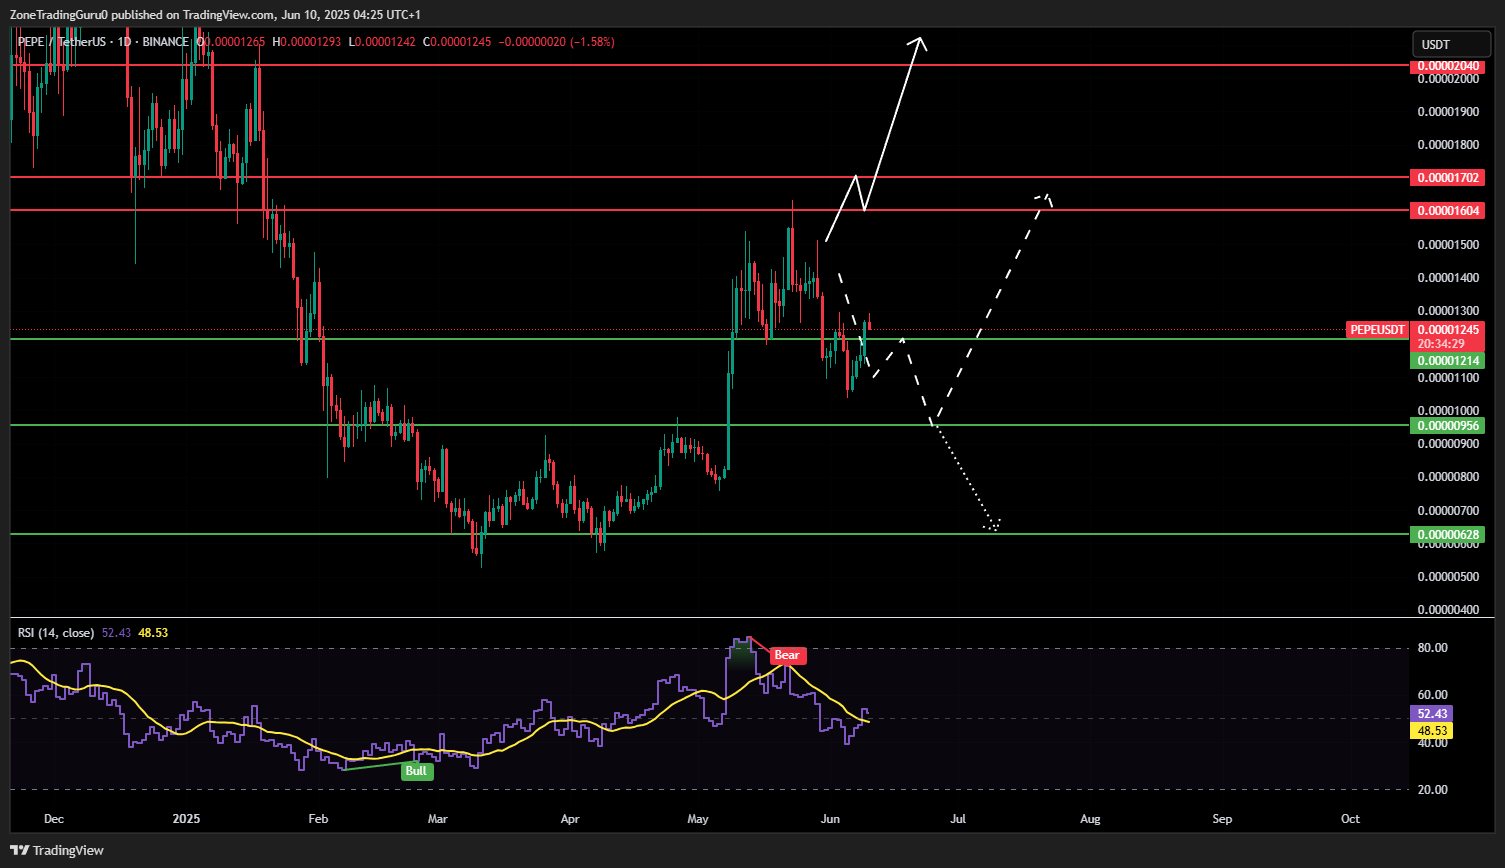
With the current price of PEPE at around 0.0000127, it is approaching the support level of 0.00001214 as previously outlined, suggesting a potential test of this zone. The analysis of the ongoing uptrend remains relevant given the strong resistance at 0.00001604.
Reiterating the scenarios:
- Case 1: If a weekly candle closes above the 0.00001604 resistance, the uptrend could continue, with potential resistance levels at 0.00001702, 0.0000204, and 0.0000216.
- Case 2: If a daily candle closes below the 0.00001214 support, a drop to the next support at 0.00000956 could occur. This lower support is considered strong, potentially leading to a bounce and a retest of the 0.00001604 resistance.
- Case 3: Should an 8-hour candle close below 0.00000956, PEPE might head toward its previous low, with an 80% chance of the uptrend plan failing and a deeper dump possible.
At 0.0000127, the price is close to the critical support. The next candle close, especially on the daily or weekly timeframe, will be key to confirming the next move.
LINK Price Prediction
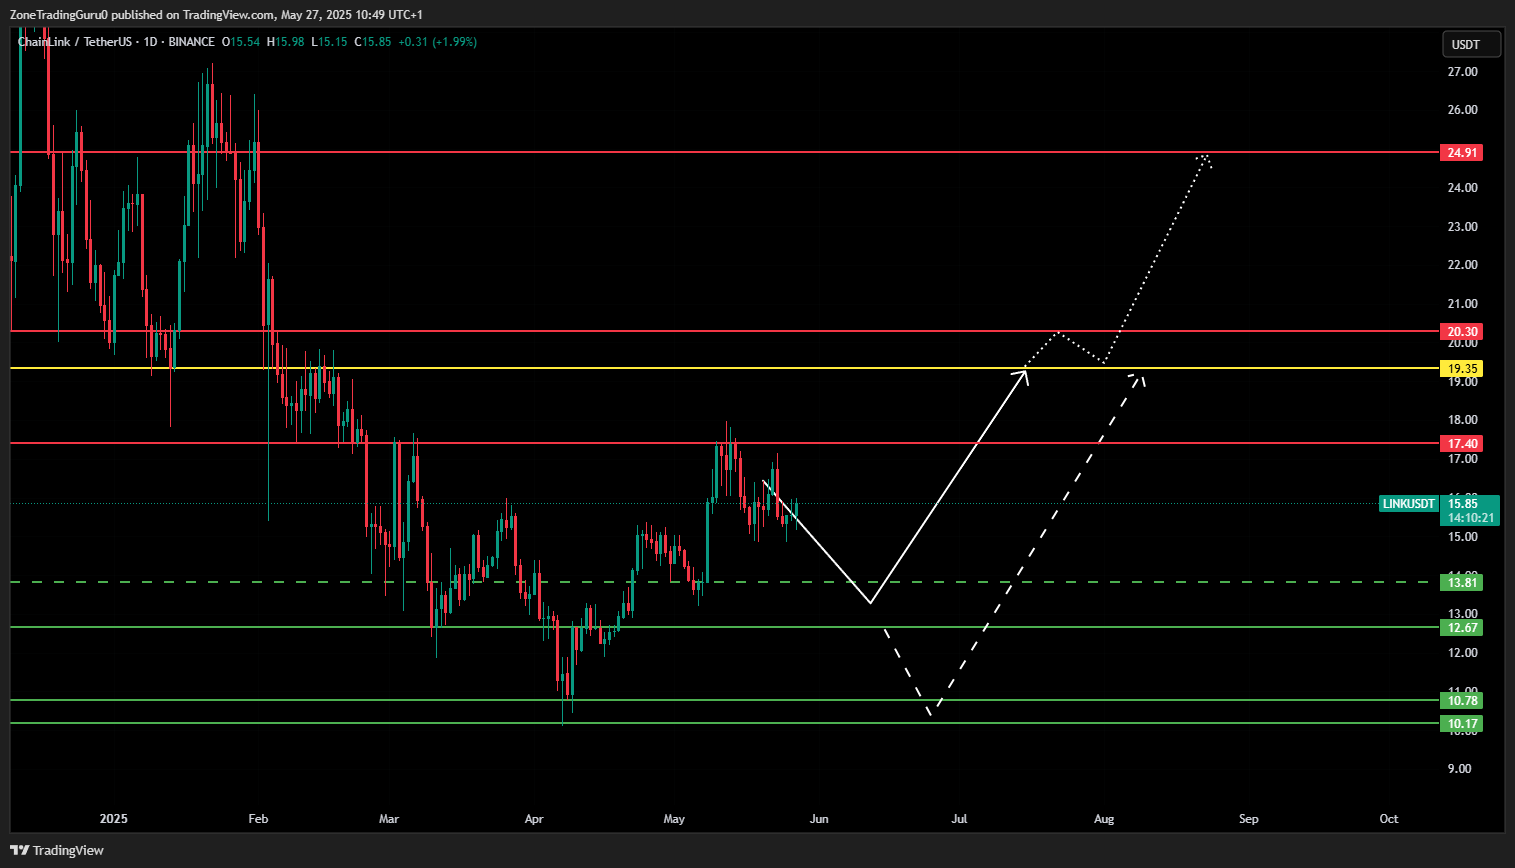
With the current price of LINK at 14.55, it has moved below the previous resistance at 17.4 but remains within a corrective phase following its break from the downtrend, as noted earlier. The price is now approaching the identified support levels, suggesting a potential bottoming phase.
Reiterating the analysis:
- The support zones for a corrective bottom are 13.81, 12.67, 10.78, and 10.17, which could serve as opportunities for long positions or spot buying and holding.
- If a 3-day candle closes below 10.15, this uptrend would likely fail, potentially leading to a deeper drop toward previous lows.
- Should the uptrend resume, resistance levels to watch are 17.4, 19.35, and 20.3, with 19.35 being a key level where a strong reaction is expected. A daily candle closing above 19.35 could push LINK toward higher resistance at 24.91, possibly reaching its previous peak.
At 14.55, the price is nearing the 13.81 support. The next few candle closes, especially on the 3-day timeframe, will be critical to confirm whether the correction continues or the uptrend resumes.
TRUM Price Prediction
Currently, the TRUMP token is experiencing heightened volatility due to strong news flows surrounding the relationship between Donald Trump and Elon Musk. Price action may become erratic as a result of this media-driven narrative.
TRUMP is currently trading within a tight range, bounded by resistance at 10.977 and support at 10.311.
The token may continue to move sideways within this band, with the possibility of sharp wicks in either direction depending on developments between Trump and Musk.
If a weekly candle (W1) closes below the 10.3 support level, the price could decline toward lower support zones around 9.654 or even deeper to the previous bottom between 8.626 and 7.12. A drop to these levels would significantly reduce the likelihood of TRUMP rallying back to the 2x$ resistance zone.
Conversely, if the token breaks above key resistance levels at 11.62, 12.5, 14.975, and 15.65, a strong upward move toward the 2x$ range could materialize.

Conclusion
Bitcoin’s recent rally has reignited bullish sentiment but faces a decisive test at $110,330, with its dominance retreat offering fresh opportunities for altcoins to shine. Ethereum, after an extended rally, now stands at a critical inflection zone – either set for new highs or poised for a sharp correction if momentum falters.
Solana, Dogecoin, and Pepe all present clear range-bound setups where disciplined trading and patience will be essential, with daily and weekly candle closes providing the strongest signals for trend confirmation.
Chainlink and TRUMP tokens, meanwhile, are hovering near key supports that could define their next major moves, but both require careful monitoring given the proximity to breakdown levels and, in TRUMP’s case, external narrative-driven risks.